- Welcome to Congo! :tada:/
- Posts/
- Some exercise about Statistical Learning/
- SL3: Analysis of Prostate Cancer dataset – variable subset selection/
SL3: Analysis of Prostate Cancer dataset – variable subset selection
Table of Contents
# data analysis and wrangling
import numpy as np # linear algebra
import pandas as pd # data processing, CSV file I/O (e.g. pd.read_csv)
# import random as rnd

# visualization
import seaborn as sns
import matplotlib.pyplot as plt
# %matplotlib inline

# machine learning
from sklearn.linear_model import LinearRegression
from sklearn.metrics import r2_score
from sklearn.metrics import mean_squared_error

import statsmodels.api as sm
import itertools # itertools functions create iterators for efficient looping
                 # itertools.combinations(p,r) creates r-length tuples, in sorted order, no repeated elements
                 # ex. combinations('ABCD', 2) = [AB AC AD BC BD CD]


#from IPython.display import Image # to visualize images
#from tabulate import tabulate # to create tables

import os
for dirname, _, filenames in os.walk('/kaggle/input'):
    for filename in filenames:
        print(os.path.join(dirname, filename))
/kaggle/input/prostate-data/tab4.png
/kaggle/input/prostate-data/tab4-no-cap.png
/kaggle/input/prostate-data/tab3.png
/kaggle/input/prostate-data/prostate.data
/kaggle/input/prostate-data/tab.png
/kaggle/input/prostate-data/tab2.png
1. Open your kernel SL_EX2_ProstateCancer_Surname in Kaggle
2. Generate a copy called SL_EX3_SubsetSelection_Surname by the Fork button
Data acquisition #
# Load the Prostate Cancer dataset
data = pd.read_csv('../input/prostate-data/prostate.data',sep='\t')
# Save "train" and lpsa" columns into Pandas Series variables
train = data['train']
lpsa = data['lpsa']

# Drop "train" and lpsa" variable from data
data = data.drop(columns=['Unnamed: 0','lpsa','train'],axis=1)
Data pre-processing #
## X VARIABLE:
# Split the data in train and test sets
dataTrain = data.loc[train == 'T'] # Obviously, len(idx)==len(dataTrain) is True!
dataTest = data.loc[train == 'F']

# Rename these two variables as "predictorsTrain" and "predictorsTest"
predictorsTrain = dataTrain
predictorsTest = dataTest


## Y VARIABLE:
# Split the "lpsa" in train and test sets
lpsaTrain = lpsa.loc[train == 'T']
lpsaTest = lpsa.loc[train == 'F']
Standardization
\[\dfrac{predictors - predictorsMeans}{predictorsStd}\]
# Standardize "predictorsTrain"
predictorsTrainMeans = predictorsTrain.mean()
predictorsTrainStds = predictorsTrain.std()
predictorsTrain_std = (predictorsTrain - predictorsTrainMeans)/predictorsTrainStds # standardized variables of predictorTrain

# Standardize "predictorsTest" (using the mean and std of predictorsTrain, it's better!)
predictorsTest_std = (predictorsTest - predictorsTrainMeans)/predictorsTrainStds # standardized variables of predictorTest
Split into Training and Test sets
## TRAINING SET
X_train = predictorsTrain_std
Y_train = lpsaTrain

## TEST SET
X_test = predictorsTest_std
Y_test = lpsaTest
Useful functions for the analysis of the Prostate_Cancer_dataset #
For Linear Regression
# Useful functions in order to compute RSS, R_squared and Zscore.
def LinReg(X_train,Y_train,X_test,Y_test):

    # Create the linear model, fitting also the intecept (non-zero)
    model = LinearRegression(fit_intercept = True)

    # Train the model on training set
    model.fit(X_train,Y_train)

    # Stats on Training set
    Y_train_pred = model.predict(X_train)
    RSS_train = mean_squared_error(Y_train,Y_train_pred) * len(Y_train)
    R2_train = model.score(X_train,Y_train)

    # Stats on Test set
    Y_test_pred = model.predict(X_test)
    RSS_test = mean_squared_error(Y_test,Y_test_pred) * len(Y_test)
    R2_test = model.score(X_test,Y_test)

    return RSS_train, RSS_test, R2_train

def Zscore(X_train,Y_train):

    # fitting the model
    model = sm.OLS(Y_train, sm.add_constant(X_train)).fit()

    Zscores = model.tvalues[1:] # we don't want const
    min_Zscore = min(abs(Zscores))
    idx_min_Zscore = abs(Zscores).idxmin() # it's the nearest to zero, so the variable less significant!

    return Zscores, min_Zscore, idx_min_Zscore
To print some info
## Print information about an iteration forward subset selection with subset size ncomb
# ncomb = number of the iteration
# features = remaining_features, selected_features (used to do the iteration and take track of the selection)
# params = all_RSS, all_R_squared, all_combs
# results = best_RSS, best_feature (results of the selection)
# detailed = parameter to see more detail about each single combination
def get_info_forwardS(ncomb,features,params,results,detailed):

    sepComb = "==="*30
    sepIter = "---"*30

    remaining, selected = features
    bestFeat, bestRSS = results

    print(f"{sepComb}\nIter n.{ncomb}:\n\
Choose {ncomb}-length combinations of the remaining variables\n\n\
Remaining features: {remaining}\n\
Features selected: {selected}")

    if detailed == 1:
        RSS, R_squared, Combs = params

        for niter in range(0,len(Combs)):
            var0 = Combs[niter]
            var1 = RSS[niter]
            var2 = R_squared[niter]
            print(f"\nComb n.{niter+1}: {var0}\n\
{sepIter}\n\
RSS test: {var1}\n\
R_squared: {var2}\
")

    print(f"\nSelected variables: {bestFeat}\n\
min RSS: {bestRSS}\n\
{sepComb}\n")

    return


## Print information about an iteration backward subset selection with subset size ncomb
# ncomb = number of the iteration
# features = [remaining_features,dropped_features_list] (used to do the iteration and take track of the selection)
# params = [all_RSS,all_R_squared,all_combs]
# results = [best_RSS,dropped_feature]
# detailed = parameter to see more detail about each single combination
def get_info_backwardS(ncomb,features,params,results,detailed):

    sepComb = "==="*30
    sepIter = "---"*30

    remaining, dropped = features
    droppedFeat, bestRSS = results

    print(f"{sepComb}\nIter n.{8 - ncomb}:\n\n\
At the beginning we have:\n\
Remaining features: {remaining}\n\
Dropped features: {dropped}\n\n\
Now we compare the model selecting {ncomb} variables")

    if detailed == 1:
        RSS, R_squared, Combs = params

        for niter in range(0,len(Combs)):
            var0 = Combs[niter]
            var1 = RSS[niter]
            var2 = R_squared[niter]
            print(f"\n\nComb n.{niter+1}: {var0}\n\
{sepIter}\n\
candidate dropped feature: {list(set(remaining)-set(var0))}\n\
RSS test: {var1}\
")

    print(f"\n\nAt the end we have:\n\
min RSS: {bestRSS}\n\
We drop: {droppedFeat}\n\
{sepComb}\n")

    return


## Print information about an iteration backward subset selection with subset size ncomb
# ncomb = number of the iteration
# features = [remaining_features,dropped_features_list] (used to do the iteration and take track of the selection)
# params = [all_RSS,all_R_squared,all_combs]
# results = [best_RSS,dropped_feature]
# detailed = parameter to see more detail about each single combination
def get_info_backwardS_Zscore(ncomb,features,params,results,detailed):

    sepComb = "==="*30
    sepIter = "---"*30

    remaining, dropped = features
    droppedFeat, bestRSS = results

    print(f"{sepComb}\nIter n.{8 - ncomb}:\n\n\
At the beginning we have:\n\
Remaining features: {remaining}\n\
Dropped features: {dropped}\n")

    print("\nThe Z-scores are:\n",Zscores)

    print(f"\n\nAt the end we have:\n\
min RSS: {bestRSS}\n\
We drop: {droppedFeat}\n\
{sepComb}\n")

    return
Best Subset Selection #
3. Starting from the `ols models` achieved in the last steps, perform best-subset selection.
- Generate one model for each combination of the 8 variables available
- For each model compute the RSS on training and test set, the number of variables and the \(R^2\) of the model
- Save these numbers in suitable data structures
## range
variables = data.columns.tolist() # excluding 'const'

## Initialize the list where we temporarily store data
RSS_train_list, RSS_test_list, R_squared_list = [], [], []
numb_features, features_list = [], []

for k in range(1,len(variables) + 1):

#     niter = 0
#     print("---"*30,f"\nStart by choosing {k} variables\n")

    # Looping over all possible combinations of k variables
    for combo in itertools.combinations(variables,k):

#         niter = niter+1

        # Compute all the statistics we need
        RSS_train, RSS_test, Rsquared_train = LinReg(X_train[list(combo)], Y_train, X_test[list(combo)], Y_test)

#         rnd = 4
#         print(f"{niter}. Variables: {list(combo)}\n\
#         RSS train: {RSS_train.round(rnd)}\n\
#         RSS test: {RSS_test.round(rnd)}\n\
#         R^2 train: {Rsquared_train.round(rnd)}\n")

        # Save the statistics
        RSS_train_list.append(RSS_train)
        RSS_test_list.append(RSS_test)
        R_squared_list.append(Rsquared_train)

        # Save features and number of features
        features_list.append(combo)
        numb_features.append(len(combo))

#     print(f"\nUsing {k} variables we have computed {niter} models")
#     print("---"*30,"\n")

#Store in DataFrame
df_BestS = pd.DataFrame({'numb_features': numb_features,\
                         'RSS_train': RSS_train_list,\
                         'RSS_test': RSS_test_list,\
                         'R_squared': R_squared_list,\
                         'features': features_list})
df_BestS
| numb_features | RSS_train | RSS_test | R_squared | features | |
|---|---|---|---|---|---|
| 0 | 1 | 44.528583 | 14.392162 | 0.537516 | (lcavol,) |
| 1 | 1 | 73.613540 | 30.402846 | 0.235434 | (lweight,) |
| 2 | 1 | 91.292039 | 33.846748 | 0.051821 | (age,) |
| 3 | 1 | 89.624912 | 35.298771 | 0.069136 | (lbph,) |
| 4 | 1 | 66.422403 | 20.632078 | 0.310122 | (svi,) |
| ... | ... | ... | ... | ... | ... |
| 250 | 7 | 31.570706 | 14.702112 | 0.672100 | (lcavol, lweight, age, svi, lcp, gleason, pgg45) |
| 251 | 7 | 30.414990 | 17.034552 | 0.684103 | (lcavol, lweight, lbph, svi, lcp, gleason, pgg45) |
| 252 | 7 | 33.265433 | 16.754443 | 0.654498 | (lcavol, age, lbph, svi, lcp, gleason, pgg45) |
| 253 | 7 | 44.036622 | 22.633329 | 0.542626 | (lweight, age, lbph, svi, lcp, gleason, pgg45) |
| 254 | 8 | 29.426384 | 15.638220 | 0.694371 | (lcavol, lweight, age, lbph, svi, lcp, gleason... |
255 rows × 5 columns
Find the best subset (of variables) for each number of features
Now our dataframe df_BestS has a row for each model computed, and it’s not easy to handle. For this reason, we extract the best model for each number of variables by observing the interesting parameter.
We consider as interesting parameter:
- minimum RSS train
- minimum RSS test
- maximum \(R^2\)
# Create new df, selection only best subsets of variables (based on RSS and R^2)
df_BestS_RSS_train= df_BestS[df_BestS.groupby('numb_features')['RSS_train'].transform(min) == df_BestS['RSS_train']]
df_BestS_RSS_test = df_BestS[df_BestS.groupby('numb_features')['RSS_test'].transform(min) == df_BestS['RSS_test']]
df_BestS_R_squared = df_BestS[df_BestS.groupby('numb_features')['R_squared'].transform(max) == df_BestS['R_squared']]
df_BestS_RSS_train
| numb_features | RSS_train | RSS_test | R_squared | features | |
|---|---|---|---|---|---|
| 0 | 1 | 44.528583 | 14.392162 | 0.537516 | (lcavol,) |
| 8 | 2 | 37.091846 | 14.774470 | 0.614756 | (lcavol, lweight) |
| 38 | 3 | 34.907749 | 12.015924 | 0.637441 | (lcavol, lweight, svi) |
| 97 | 4 | 32.814995 | 13.689964 | 0.659176 | (lcavol, lweight, lbph, svi) |
| 174 | 5 | 32.069447 | 14.577726 | 0.666920 | (lcavol, lweight, lbph, svi, pgg45) |
| 229 | 6 | 30.539778 | 16.457800 | 0.682807 | (lcavol, lweight, lbph, svi, lcp, pgg45) |
| 247 | 7 | 29.437300 | 15.495405 | 0.694258 | (lcavol, lweight, age, lbph, svi, lcp, pgg45) |
| 254 | 8 | 29.426384 | 15.638220 | 0.694371 | (lcavol, lweight, age, lbph, svi, lcp, gleason... |
df_BestS_RSS_test
| numb_features | RSS_train | RSS_test | R_squared | features | |
|---|---|---|---|---|---|
| 0 | 1 | 44.528583 | 14.392162 | 0.537516 | (lcavol,) |
| 11 | 2 | 42.312584 | 11.583584 | 0.560532 | (lcavol, svi) |
| 52 | 3 | 42.267034 | 11.484038 | 0.561005 | (lcavol, svi, gleason) |
| 112 | 4 | 42.223638 | 11.612573 | 0.561456 | (lcavol, age, svi, gleason) |
| 167 | 5 | 34.170209 | 11.497692 | 0.645101 | (lcavol, lweight, age, svi, gleason) |
| 226 | 6 | 33.642783 | 12.009380 | 0.650579 | (lcavol, lweight, age, svi, gleason, pgg45) |
| 246 | 7 | 30.958630 | 13.492898 | 0.678457 | (lcavol, lweight, age, lbph, svi, lcp, gleason) |
| 254 | 8 | 29.426384 | 15.638220 | 0.694371 | (lcavol, lweight, age, lbph, svi, lcp, gleason... |
# the same as selecting min RSS on training set
df_BestS_R_squared
| numb_features | RSS_train | RSS_test | R_squared | features | |
|---|---|---|---|---|---|
| 0 | 1 | 44.528583 | 14.392162 | 0.537516 | (lcavol,) |
| 8 | 2 | 37.091846 | 14.774470 | 0.614756 | (lcavol, lweight) |
| 38 | 3 | 34.907749 | 12.015924 | 0.637441 | (lcavol, lweight, svi) |
| 97 | 4 | 32.814995 | 13.689964 | 0.659176 | (lcavol, lweight, lbph, svi) |
| 174 | 5 | 32.069447 | 14.577726 | 0.666920 | (lcavol, lweight, lbph, svi, pgg45) |
| 229 | 6 | 30.539778 | 16.457800 | 0.682807 | (lcavol, lweight, lbph, svi, lcp, pgg45) |
| 247 | 7 | 29.437300 | 15.495405 | 0.694258 | (lcavol, lweight, age, lbph, svi, lcp, pgg45) |
| 254 | 8 | 29.426384 | 15.638220 | 0.694371 | (lcavol, lweight, age, lbph, svi, lcp, gleason... |
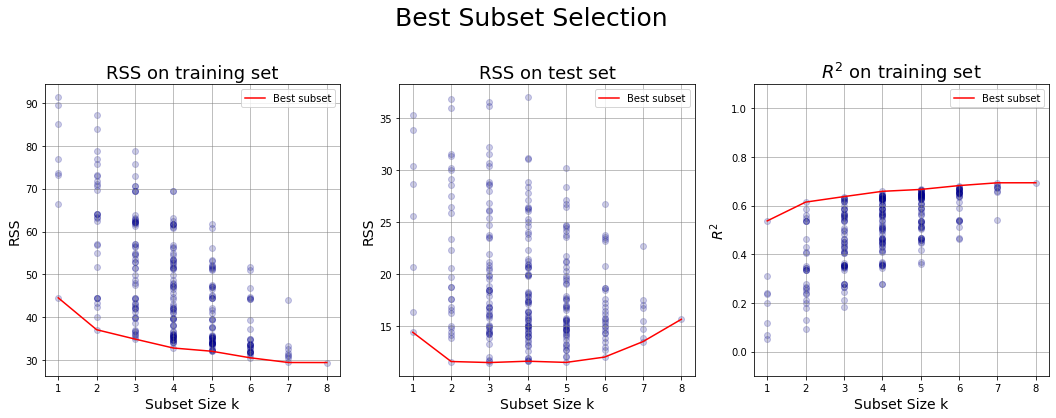
Plots for Best Selection #
4. + 5. + 6. Generate some charts:
- x-axis: the subset size
- y-axis:
- RSS for training set of all the models generated at step 3
- \(R^2\) of all the models generated at step 3
- RSS for test set of all the models generated at step 3
# Initialize the figure
width = 6
height = 6
nfig = 3
fig = plt.figure(figsize = (width*nfig,height))

# 1. RSS Training set plot
tmp_df1 = df_BestS;           # scatter plot
tmp_df2 = df_BestS_RSS_train; # plot the line of best values
ax1 = fig.add_subplot(1, nfig, 1)
ax1.scatter(tmp_df1.numb_features,tmp_df1.RSS_train, alpha = .2, color = 'darkblue');
ax1.set_xlabel('Subset Size k',fontsize=14);
ax1.set_ylabel('RSS',fontsize=14);
ax1.set_title('RSS on training set',fontsize=18);
ax1.plot(tmp_df2.numb_features,tmp_df2.RSS_train,color = 'r', label = 'Best subset'); # line of best values
ax1.grid(color='grey', linestyle='-', linewidth=0.5);
ax1.legend();

# 2. RSS Test set plot
tmp_df1 = df_BestS;           # scatter plot
tmp_df2 = df_BestS_RSS_test;  # plot the line of best values
ax2 = fig.add_subplot(1, nfig, 2);
ax2.scatter(tmp_df1.numb_features,tmp_df1.RSS_test, alpha = .2, color = 'darkblue');
ax2.set_xlabel('Subset Size k',fontsize=14);
ax2.set_ylabel('RSS',fontsize=14);
ax2.set_title('RSS on test set',fontsize=18);
ax2.plot(tmp_df2.numb_features,tmp_df2.RSS_test,color = 'r', label = 'Best subset'); # line of best values
ax2.grid(color='grey', linestyle='-', linewidth=0.5);
ax2.legend();

# 3. R^2 plot
tmp_df1 = df_BestS;           # scatter plot
tmp_df2 = df_BestS_R_squared;  # plot the line of best values
ax3 = fig.add_subplot(1, nfig, 3);
ax3.scatter(tmp_df1.numb_features,tmp_df1.R_squared, alpha = .2, color = 'darkblue');
ax3.set_xlabel('Subset Size k',fontsize=14);
ax3.set_ylabel('$R^2$',fontsize=14);
ax3.set_ylim(bottom=-0.1,top=1.1)
ax3.set_title('$R^2$ on training set',fontsize=18);
ax3.plot(tmp_df2.numb_features,tmp_df2.R_squared,color = 'r', label = 'Best subset'); # line of best values
ax3.grid(color='grey', linestyle='-', linewidth=0.5);
ax3.legend();

fig.suptitle('Best Subset Selection',fontsize=25, y=0.98);
fig.subplots_adjust(top=0.8)
plt.show();
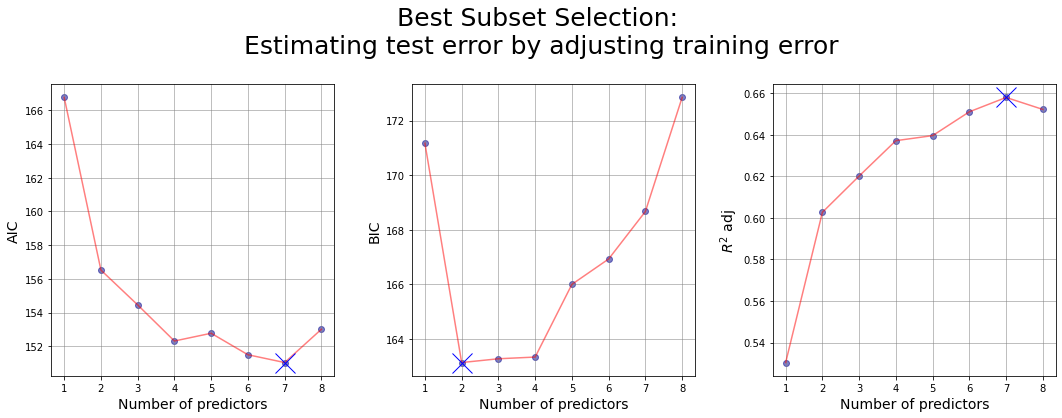
Estimating test error by adjusting training error #
In general, the training set MSE underestimates the test MSE. In fact we fit a model to the training data using least squares and we estimate the coefficients of the regression in such a way the training RSS is minimized. So the training RSS decreases as we add more variables to the model, but the test RSS may not!
For this reason the training RSS (and so also \(R^2\)) may not be used directly for selecting the best model, but we need to adjust them to get an estimate of the test error.
Attempt n.1: using sklearn library
AIC_list, BIC_list, R_squared_adj_list =[], [], [] # from sklearn I can get no Cp estimate out of the box.
best_features = df_BestS_RSS_train['features']

for features in best_features:

    regr = sm.OLS(Y_train, sm.add_constant(X_train[list(features)])).fit()

    AIC_list.append(regr.aic)
    BIC_list.append(regr.bic)
    R_squared_adj_list.append(regr.rsquared_adj)
#Store in DataFrame
df1 = pd.DataFrame({'numb_features': df_BestS_RSS_train['numb_features'],\
                    'RSS_train': df_BestS_RSS_train['RSS_train'],\
                    'features': df_BestS_RSS_train['features'],\
                    'AIC': AIC_list,\
                   'BIC': BIC_list,\
                   'R_squared_adj': R_squared_adj_list})

df1
| numb_features | RSS_train | features | AIC | BIC | R_squared_adj | |
|---|---|---|---|---|---|---|
| 0 | 1 | 44.528583 | (lcavol,) | 166.764154 | 171.173540 | 0.530401 |
| 8 | 2 | 37.091846 | (lcavol, lweight) | 156.520967 | 163.135045 | 0.602717 |
| 38 | 3 | 34.907749 | (lcavol, lweight, svi) | 154.454850 | 163.273620 | 0.620176 |
| 97 | 4 | 32.814995 | (lcavol, lweight, lbph, svi) | 152.312691 | 163.336154 | 0.637188 |
| 174 | 5 | 32.069447 | (lcavol, lweight, lbph, svi, pgg45) | 152.772911 | 166.001067 | 0.639618 |
| 229 | 6 | 30.539778 | (lcavol, lweight, lbph, svi, lcp, pgg45) | 151.498370 | 166.931219 | 0.651088 |
| 247 | 7 | 29.437300 | (lcavol, lweight, age, lbph, svi, lcp, pgg45) | 151.034951 | 168.672492 | 0.657983 |
| 254 | 8 | 29.426384 | (lcavol, lweight, age, lbph, svi, lcp, gleason... | 153.010102 | 172.852336 | 0.652215 |
# Initialize the figure
width = 6
height = 6
nfig = 3
fig = plt.figure(figsize = (width*nfig,height))

# 1. AIC
ax1 = fig.add_subplot(1, nfig, 1)
ax1.scatter(df1['numb_features'],df1['AIC'], alpha = .5, color = 'darkblue');
ax1.plot(df1['numb_features'],df1['AIC'],color = 'r', alpha = .5); # line of best values
ax1.plot(df1['AIC'].argmin()+1, df1['AIC'].min(), marker='x', markersize=20, color = 'b'); # best val
ax1.set_xlabel('Number of predictors',fontsize=14);
ax1.set_ylabel('AIC',fontsize=14);
ax1.grid(color='grey', linestyle='-', linewidth=0.5);

# 2. BIC
ax2 = fig.add_subplot(1, nfig, 2)
ax2.scatter(df1['numb_features'],df1['BIC'], alpha = .5, color = 'darkblue');
ax2.plot(df1['numb_features'],df1['BIC'],color = 'r', alpha = .5); # line of best values
ax2.plot(df1['BIC'].argmin()+1, df1['BIC'].min(), marker='x', markersize=20, color = 'b'); # best val
ax2.set_xlabel('Number of predictors',fontsize=14);
ax2.set_ylabel('BIC',fontsize=14);
ax2.grid(color='grey', linestyle='-', linewidth=0.5);

# 3. R2_adj
ax3 = fig.add_subplot(1, nfig, 3)
ax3.scatter(df1['numb_features'],df1['R_squared_adj'], alpha = .5, color = 'darkblue');
ax3.plot(df1['numb_features'],df1['R_squared_adj'],color = 'r', alpha = .5); # line of best values
ax3.plot(df1['R_squared_adj'].argmax()+1, df1['R_squared_adj'].max(), marker='x', markersize=20, color = 'b'); # best val
ax3.set_xlabel('Number of predictors',fontsize=14);
ax3.set_ylabel(r'$R^2$ adj',fontsize=14);
ax3.grid(color='grey', linestyle='-', linewidth=0.5);

fig.suptitle('Best Subset Selection:\n Estimating test error by adjusting training error',fontsize=25, y=0.98);
fig.subplots_adjust(top=0.8)
fig.subplots_adjust(wspace=0.275) # the amount of width reserved for blank space between subplots
plt.show();
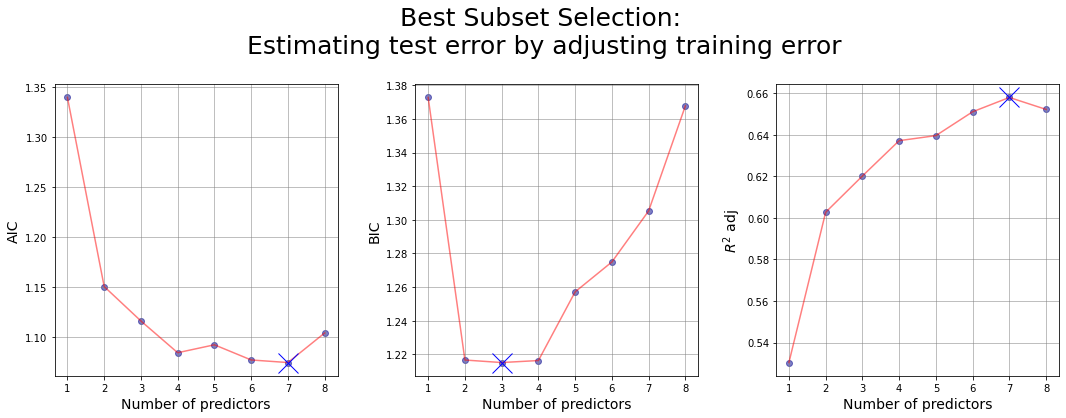
Attempt n.2: estimating AIC, BIC and R^2 adjusted by our own
#Initializing useful variables
n = len(Y_train)
d = df_BestS_RSS_train['numb_features']
p = 8
RSS = df_BestS_RSS_train['RSS_train']
Rsquared = df_BestS_RSS_train['R_squared']

# Estimation of sigma^2: RSE of the general multiple Linear regression with p features
RSE = np.sqrt(min(RSS)/(n - p -1))  # min(RSS) is the RSS of the full model with p predictors
hat_sigma_squared = RSE**2

#Computing
AIC = (1/(n*hat_sigma_squared)) * (RSS + 2 * d * hat_sigma_squared )
BIC = (1/(n*hat_sigma_squared)) * (RSS +  np.log(n) * d * hat_sigma_squared )

ratio = 1 - Rsquared # RSS/TSS
R_squared_adj = 1 - ratio*(n-1)/(n-d-1)
#Store in DataFrame
df2 = pd.DataFrame({'numb_features': df_BestS_RSS_train['numb_features'],\
                    'RSS_train': df_BestS_RSS_train['RSS_train'],\
                    'features': df_BestS_RSS_train['features'],\
                    'AIC': AIC,\
                    'BIC': BIC,\
                    'R_squared_adj': R_squared_adj})

df2
| numb_features | RSS_train | features | AIC | BIC | R_squared_adj | |
|---|---|---|---|---|---|---|
| 0 | 1 | 44.528583 | (lcavol,) | 1.339802 | 1.372708 | 0.530401 |
| 8 | 2 | 37.091846 | (lcavol, lweight) | 1.150877 | 1.216689 | 0.602717 |
| 38 | 3 | 34.907749 | (lcavol, lweight, svi) | 1.116476 | 1.215193 | 0.620176 |
| 97 | 4 | 32.814995 | (lcavol, lweight, lbph, svi) | 1.084761 | 1.216385 | 0.637188 |
| 174 | 5 | 32.069447 | (lcavol, lweight, lbph, svi, pgg45) | 1.092680 | 1.257209 | 0.639618 |
| 229 | 6 | 30.539778 | (lcavol, lweight, lbph, svi, lcp, pgg45) | 1.077530 | 1.274965 | 0.651088 |
| 247 | 7 | 29.437300 | (lcavol, lweight, age, lbph, svi, lcp, pgg45) | 1.074948 | 1.305289 | 0.657983 |
| 254 | 8 | 29.426384 | (lcavol, lweight, age, lbph, svi, lcp, gleason... | 1.104478 | 1.367724 | 0.652215 |
# Initialize the figure
width = 6
height = 6
nfig = 3
fig = plt.figure(figsize = (width*nfig,height))

# 1. AIC
ax1 = fig.add_subplot(1, nfig, 1)
ax1.scatter(df2['numb_features'],df2['AIC'], alpha = .5, color = 'darkblue');
ax1.plot(df2['numb_features'],df2['AIC'],color = 'r', alpha = .5); # line of best values
ax1.plot(df2['AIC'].argmin()+1, df2['AIC'].min(), marker='x', markersize=20, color = 'b'); # best val
ax1.set_xlabel('Number of predictors',fontsize=14);
ax1.set_ylabel('AIC',fontsize=14);
ax1.grid(color='grey', linestyle='-', linewidth=0.5);

# 2. BIC
ax2 = fig.add_subplot(1, nfig, 2)
ax2.scatter(df2['numb_features'],df2['BIC'], alpha = .5, color = 'darkblue');
ax2.plot(df2['numb_features'],df2['BIC'],color = 'r', alpha = .5); # line of best values
ax2.plot(df2['BIC'].argmin()+1, df2['BIC'].min(), marker='x', markersize=20, color = 'b'); # best val
ax2.set_xlabel('Number of predictors',fontsize=14);
ax2.set_ylabel('BIC',fontsize=14);
ax2.grid(color='grey', linestyle='-', linewidth=0.5);

# 3. R2_adj
ax3 = fig.add_subplot(1, nfig, 3)
ax3.scatter(df2['numb_features'],df2['R_squared_adj'], alpha = .5, color = 'darkblue');
ax3.plot(df2['numb_features'],df2['R_squared_adj'],color = 'r', alpha = .5); # line of best values
ax3.plot(df2['R_squared_adj'].argmax()+1, df2['R_squared_adj'].max(), marker='x', markersize=20, color = 'b'); # best val
ax3.set_xlabel('Number of predictors',fontsize=14);
ax3.set_ylabel(r'$R^2$ adj',fontsize=14);
ax3.grid(color='grey', linestyle='-', linewidth=0.5);

fig.suptitle('Best Subset Selection:\n Estimating test error by adjusting training error',fontsize=25, y=0.98);
fig.subplots_adjust(top=0.8)
fig.subplots_adjust(wspace=0.275) # the amount of width reserved for blank space between subplots
plt.show();
Forward selection #
For computational reasons, the best subset cannot be applied for any large n due to the \(2^n\) complexity.
Forward Stepwise begins with a model containing no predictors, and then adds predictors to the model, one at the time. At each step, the variable that gives the greatest additional improvement to the fit is added to the model.
7. Perform forward selection
- Start from the empty model
- Add at each step the variable that minimizes the RSS computed on test set (other performance measures can be used)
# to print some info:
flag = 1
detailed = 1
## range
variables = data.columns.tolist()
remaining_features, selected_features = variables.copy(), []

## Initialize the list where we temporarily store data
RSS_test_list, min_RSS_test_list, R_squared_list = [], [], []
numb_features, features_list = [], []

# Loop over the number of variables
for k in range(1,len(variables)+1):

    # store some info for each k
    all_RSS, all_R_squared, all_combs = [],[], []
    best_RSS = np.inf # initialize the best RSS as +inf

    # choose one variable in the remaining features
    for var in remaining_features:

        tmpComb = selected_features + [var]; # combination of variables

        # Compute all the statistics we need
        _, RSS_test, R_squared = LinReg(X_train[tmpComb], Y_train, X_test[tmpComb], Y_test) # we don't want RSS on training set

        # save temporary stats
        all_RSS.append(RSS_test)
        all_R_squared.append(R_squared)
        all_combs.append(tmpComb)

        # update if we reach a better RSS
        if RSS_test < best_RSS:
            best_RSS = RSS_test
            best_R_squared = R_squared
            best_feature = var

    # Print some information, before upgrading the features
    if flag == 1:
        features = [remaining_features,selected_features]
        params = [all_RSS,all_R_squared,all_combs]
        results = [best_feature,best_RSS]
        get_info_forwardS(k,features,params,results,detailed)

    # Save the statistics
    RSS_test_list.append(all_RSS)
    min_RSS_test_list.append(best_RSS)
    R_squared_list.append(best_R_squared)

    # Update variables for next loop
    selected_features.append(best_feature)
    remaining_features.remove(best_feature)

    # Save features and number of features
    features_list.append(selected_features.copy())
    numb_features.append(len(selected_features))

# Store in DataFrame
df_ForwardS = pd.DataFrame({'numb_features': numb_features,\
                            'RSS_test' : RSS_test_list,\
                            'min_RSS_test': min_RSS_test_list,\
                            'R_squared': R_squared_list,\
                            'features': features_list})
==========================================================================================
Iter n.1:
Choose 1-length combinations of the remaining variables

Remaining features: ['lcavol', 'lweight', 'age', 'lbph', 'svi', 'lcp', 'gleason', 'pgg45']
Features selected: []

Comb n.1: ['lcavol']
------------------------------------------------------------------------------------------
RSS test: 14.392161587304827
R_squared: 0.5375164690552883

Comb n.2: ['lweight']
------------------------------------------------------------------------------------------
RSS test: 30.402845602615997
R_squared: 0.23543378299009432

Comb n.3: ['age']
------------------------------------------------------------------------------------------
RSS test: 33.846748424133
R_squared: 0.05182105437299367

Comb n.4: ['lbph']
------------------------------------------------------------------------------------------
RSS test: 35.29877101280492
R_squared: 0.06913619684911343

Comb n.5: ['svi']
------------------------------------------------------------------------------------------
RSS test: 20.632078139876853
R_squared: 0.3101224985902339

Comb n.6: ['lcp']
------------------------------------------------------------------------------------------
RSS test: 16.34576112489144
R_squared: 0.23931977441332264

Comb n.7: ['gleason']
------------------------------------------------------------------------------------------
RSS test: 25.529830407597565
R_squared: 0.11725680432657692

Comb n.8: ['pgg45']
------------------------------------------------------------------------------------------
RSS test: 28.61697167270323
R_squared: 0.20074696985742568

Selected variables: lcavol
min RSS: 14.392161587304827
==========================================================================================

==========================================================================================
Iter n.2:
Choose 2-length combinations of the remaining variables

Remaining features: ['lweight', 'age', 'lbph', 'svi', 'lcp', 'gleason', 'pgg45']
Features selected: ['lcavol']

Comb n.1: ['lcavol', 'lweight']
------------------------------------------------------------------------------------------
RSS test: 14.77447043041511
R_squared: 0.614756035022443

Comb n.2: ['lcavol', 'age']
------------------------------------------------------------------------------------------
RSS test: 14.454316401468965
R_squared: 0.53785859616379

Comb n.3: ['lcavol', 'lbph']
------------------------------------------------------------------------------------------
RSS test: 16.237234684619743
R_squared: 0.5846312407995875

Comb n.4: ['lcavol', 'svi']
------------------------------------------------------------------------------------------
RSS test: 11.58358360007023
R_squared: 0.5605323092792945

Comb n.5: ['lcavol', 'lcp']
------------------------------------------------------------------------------------------
RSS test: 15.038931408454383
R_squared: 0.5381501805446671

Comb n.6: ['lcavol', 'gleason']
------------------------------------------------------------------------------------------
RSS test: 14.140851461764317
R_squared: 0.5386018755651162

Comb n.7: ['lcavol', 'pgg45']
------------------------------------------------------------------------------------------
RSS test: 13.827662568490943
R_squared: 0.5489982126930548

Selected variables: svi
min RSS: 11.58358360007023
==========================================================================================

==========================================================================================
Iter n.3:
Choose 3-length combinations of the remaining variables

Remaining features: ['lweight', 'age', 'lbph', 'lcp', 'gleason', 'pgg45']
Features selected: ['lcavol', 'svi']

Comb n.1: ['lcavol', 'svi', 'lweight']
------------------------------------------------------------------------------------------
RSS test: 12.015924403078804
R_squared: 0.6374405385171893

Comb n.2: ['lcavol', 'svi', 'age']
------------------------------------------------------------------------------------------
RSS test: 11.71416952499475
R_squared: 0.5612383365966047

Comb n.3: ['lcavol', 'svi', 'lbph']
------------------------------------------------------------------------------------------
RSS test: 14.353733928669755
R_squared: 0.6264131675413883

Comb n.4: ['lcavol', 'svi', 'lcp']
------------------------------------------------------------------------------------------
RSS test: 13.285116624863331
R_squared: 0.5714253936028364

Comb n.5: ['lcavol', 'svi', 'gleason']
------------------------------------------------------------------------------------------
RSS test: 11.484037587414818
R_squared: 0.5610054092768177

Comb n.6: ['lcavol', 'svi', 'pgg45']
------------------------------------------------------------------------------------------
RSS test: 11.632246428034497
R_squared: 0.5651377944544718

Selected variables: gleason
min RSS: 11.484037587414818
==========================================================================================

==========================================================================================
Iter n.4:
Choose 4-length combinations of the remaining variables

Remaining features: ['lweight', 'age', 'lbph', 'lcp', 'pgg45']
Features selected: ['lcavol', 'svi', 'gleason']

Comb n.1: ['lcavol', 'svi', 'gleason', 'lweight']
------------------------------------------------------------------------------------------
RSS test: 11.95602065641986
R_squared: 0.6405674126734184

Comb n.2: ['lcavol', 'svi', 'gleason', 'age']
------------------------------------------------------------------------------------------
RSS test: 11.612572746859495
R_squared: 0.5614561297716232

Comb n.3: ['lcavol', 'svi', 'gleason', 'lbph']
------------------------------------------------------------------------------------------
RSS test: 14.355178421938225
R_squared: 0.6266591566646609

Comb n.4: ['lcavol', 'svi', 'gleason', 'lcp']
------------------------------------------------------------------------------------------
RSS test: 13.185630584098526
R_squared: 0.5741698339447385

Comb n.5: ['lcavol', 'svi', 'gleason', 'pgg45']
------------------------------------------------------------------------------------------
RSS test: 11.919697961636555
R_squared: 0.5664871741058846

Selected variables: age
min RSS: 11.612572746859495
==========================================================================================

==========================================================================================
Iter n.5:
Choose 5-length combinations of the remaining variables

Remaining features: ['lweight', 'lbph', 'lcp', 'pgg45']
Features selected: ['lcavol', 'svi', 'gleason', 'age']

Comb n.1: ['lcavol', 'svi', 'gleason', 'age', 'lweight']
------------------------------------------------------------------------------------------
RSS test: 11.497691985782547
R_squared: 0.64510079253458

Comb n.2: ['lcavol', 'svi', 'gleason', 'age', 'lbph']
------------------------------------------------------------------------------------------
RSS test: 13.947298386201728
R_squared: 0.6294946547801643

Comb n.3: ['lcavol', 'svi', 'gleason', 'age', 'lcp']
------------------------------------------------------------------------------------------
RSS test: 13.234367776364218
R_squared: 0.574264491209014

Comb n.4: ['lcavol', 'svi', 'gleason', 'age', 'pgg45']
------------------------------------------------------------------------------------------
RSS test: 12.141763999596828
R_squared: 0.5670143538267589

Selected variables: lweight
min RSS: 11.497691985782547
==========================================================================================

==========================================================================================
Iter n.6:
Choose 6-length combinations of the remaining variables

Remaining features: ['lbph', 'lcp', 'pgg45']
Features selected: ['lcavol', 'svi', 'gleason', 'age', 'lweight']

Comb n.1: ['lcavol', 'svi', 'gleason', 'age', 'lweight', 'lbph']
------------------------------------------------------------------------------------------
RSS test: 12.98960324749752
R_squared: 0.6696630706385877

Comb n.2: ['lcavol', 'svi', 'gleason', 'age', 'lweight', 'lcp']
------------------------------------------------------------------------------------------
RSS test: 12.690514046312407
R_squared: 0.6563534839394491

Comb n.3: ['lcavol', 'svi', 'gleason', 'age', 'lweight', 'pgg45']
------------------------------------------------------------------------------------------
RSS test: 12.009380388381148
R_squared: 0.6505787510646934

Selected variables: pgg45
min RSS: 12.009380388381148
==========================================================================================

==========================================================================================
Iter n.7:
Choose 7-length combinations of the remaining variables

Remaining features: ['lbph', 'lcp']
Features selected: ['lcavol', 'svi', 'gleason', 'age', 'lweight', 'pgg45']

Comb n.1: ['lcavol', 'svi', 'gleason', 'age', 'lweight', 'pgg45', 'lbph']
------------------------------------------------------------------------------------------
RSS test: 13.834231490831279
R_squared: 0.6760051914465672

Comb n.2: ['lcavol', 'svi', 'gleason', 'age', 'lweight', 'pgg45', 'lcp']
------------------------------------------------------------------------------------------
RSS test: 14.702111705571856
R_squared: 0.6720997902395782

Selected variables: lbph
min RSS: 13.834231490831279
==========================================================================================

==========================================================================================
Iter n.8:
Choose 8-length combinations of the remaining variables

Remaining features: ['lcp']
Features selected: ['lcavol', 'svi', 'gleason', 'age', 'lweight', 'pgg45', 'lbph']

Comb n.1: ['lcavol', 'svi', 'gleason', 'age', 'lweight', 'pgg45', 'lbph', 'lcp']
------------------------------------------------------------------------------------------
RSS test: 15.638220165228002
R_squared: 0.6943711796768238

Selected variables: lcp
min RSS: 15.638220165228002
==========================================================================================
# look at the result
df_ForwardS
| numb_features | RSS_test | min_RSS_test | R_squared | features | |
|---|---|---|---|---|---|
| 0 | 1 | [14.392161587304827, 30.402845602615997, 33.84... | 14.392162 | 0.537516 | [lcavol] |
| 1 | 2 | [14.77447043041511, 14.454316401468965, 16.237... | 11.583584 | 0.560532 | [lcavol, svi] |
| 2 | 3 | [12.015924403078804, 11.71416952499475, 14.353... | 11.484038 | 0.561005 | [lcavol, svi, gleason] |
| 3 | 4 | [11.95602065641986, 11.612572746859495, 14.355... | 11.612573 | 0.561456 | [lcavol, svi, gleason, age] |
| 4 | 5 | [11.497691985782547, 13.947298386201728, 13.23... | 11.497692 | 0.645101 | [lcavol, svi, gleason, age, lweight] |
| 5 | 6 | [12.98960324749752, 12.690514046312407, 12.009... | 12.009380 | 0.650579 | [lcavol, svi, gleason, age, lweight, pgg45] |
| 6 | 7 | [13.834231490831279, 14.702111705571856] | 13.834231 | 0.676005 | [lcavol, svi, gleason, age, lweight, pgg45, lbph] |
| 7 | 8 | [15.638220165228002] | 15.638220 | 0.694371 | [lcavol, svi, gleason, age, lweight, pgg45, lb... |
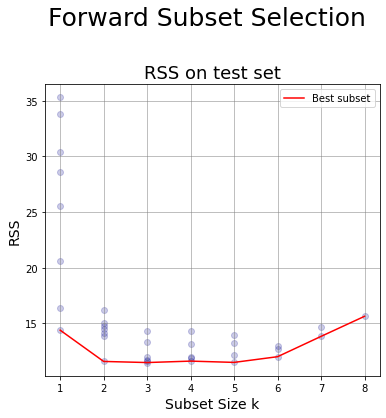
Plot for Forward Selection #
8. Generate a chart having:
- x-axis: the subset size
- y-axis: the RSS for the test set of the models generated at step 7
# Initialize the figure
width = 6
height = 6
nfig = 1
fig = plt.figure(figsize = (width*nfig,height))

# 1. RSS Test set plot
tmp_df = df_ForwardS;
ax = fig.add_subplot(1, nfig, 1)
for i in range(0,len(tmp_df.RSS_test)):
    ax.scatter([tmp_df.numb_features[i]]*(len(tmp_df.RSS_test[i])),tmp_df.RSS_test[i], alpha = .2, color = 'darkblue');

ax.set_xlabel('Subset Size k',fontsize=14);
ax.set_ylabel('RSS',fontsize=14);
ax.set_title('RSS on test set',fontsize=18);
ax.plot(tmp_df.numb_features,tmp_df.min_RSS_test,color = 'r', label = 'Best subset'); # line of best values
ax.grid(color='grey', linestyle='-', linewidth=0.5);
ax.legend();

fig.suptitle('Forward Subset Selection',fontsize=25, y=0.98);
fig.subplots_adjust(top=0.8)
plt.show()
Backward selection #
Another alternative to best subset selection is Backward Stepwise Selection.
Backward Stepwise begins with a model containing all the predictors, and then removes predictors to the model, one at the time. At each step, the variable that gives the least improvement to the fit is removed to the model.
Backward selection requires that the number of samples \(n\) is larger than the number of variables \(p\). Instead, Forward selection can be used evene \(n<p\).
9. Perform backward selection
- Start from the full model
- Remove at each step the variable that minimizes the RSS (other performance measures can be used)
# a flag to print some info, values {0,1}
flag = 1     # for short info
detailed = 1
## range
variables = data.columns.tolist()         # excluding 'const'
remaining_features, dropped_features_list = variables.copy(), []

## Initialize the list where we temporarily store data
RSS_test_list, min_RSS_test_list, R_squared_list = [], [], []
numb_features, features_list = [], []

# run over the number of variables
for k in range(len(variables),0,-1):

    # initialization
    best_RSS = np.inf
    all_RSS, all_R_squared, all_combs = [],[], []

    for combo in itertools.combinations(remaining_features,k):

        # Compute the stats we need
        tmpComb = list(combo)
        _, RSS_test, R_squared = LinReg(X_train[tmpComb], Y_train, X_test[tmpComb], Y_test) # we don't want RSS on training set

        # store all the RSS
        all_RSS.append(RSS_test)
        all_R_squared.append(R_squared)
        all_combs.append(tmpComb)

        if RSS_test < best_RSS:
            best_RSS = RSS_test
            best_R_squared = R_squared
            dropped_list = list(set(remaining_features)-set(tmpComb))

    # Print some information, before upgrading the features
    if flag == 1:
        features = [remaining_features,dropped_features_list]
        params = [all_RSS,all_R_squared,all_combs]
        if dropped_list: # only if dropped_feature is not an empty list
            dropped_feature = dropped_list[0]
            results = [dropped_feature,best_RSS]
        else:
            results = [[],best_RSS]

        get_info_backwardS(k,features,params,results,detailed)

    # Updating variables for next loop
    if dropped_list: # only if dropped_feature is not an empty list
        dropped_feature = dropped_list[0]
        remaining_features.remove(dropped_feature)
        dropped_features_list.append(dropped_feature)
    else:
        dropped_features_list.append([]) # at the initial iteration we drop nothing!

    # Save stats
    min_RSS_test_list.append(best_RSS)
    RSS_test_list.append(all_RSS.copy())
    R_squared_list.append(best_R_squared.copy())

    # Save features and number of features
    numb_features.append(len(remaining_features))
    features_list.append(remaining_features.copy())

# Store in DataFrame
df_BackwardS = pd.DataFrame({'numb_features': numb_features,\
                             'RSS_test' : RSS_test_list,\
                             'min_RSS_test': min_RSS_test_list,\
                             'R_squared': R_squared_list,\
                             'dropped_feature': dropped_features_list,\
                             'features': features_list})
==========================================================================================
Iter n.0:

At the beginning we have:
Remaining features: ['lcavol', 'lweight', 'age', 'lbph', 'svi', 'lcp', 'gleason', 'pgg45']
Dropped features: []

Now we compare the model selecting 8 variables


Comb n.1: ['lcavol', 'lweight', 'age', 'lbph', 'svi', 'lcp', 'gleason', 'pgg45']
------------------------------------------------------------------------------------------
candidate dropped feature: []
RSS test: 15.638220165228002


At the end we have:
min RSS: 15.638220165228002
We drop: []
==========================================================================================

==========================================================================================
Iter n.1:

At the beginning we have:
Remaining features: ['lcavol', 'lweight', 'age', 'lbph', 'svi', 'lcp', 'gleason', 'pgg45']
Dropped features: [[]]

Now we compare the model selecting 7 variables


Comb n.1: ['lcavol', 'lweight', 'age', 'lbph', 'svi', 'lcp', 'gleason']
------------------------------------------------------------------------------------------
candidate dropped feature: ['pgg45']
RSS test: 13.492898446056923


Comb n.2: ['lcavol', 'lweight', 'age', 'lbph', 'svi', 'lcp', 'pgg45']
------------------------------------------------------------------------------------------
candidate dropped feature: ['gleason']
RSS test: 15.495404626758


Comb n.3: ['lcavol', 'lweight', 'age', 'lbph', 'svi', 'gleason', 'pgg45']
------------------------------------------------------------------------------------------
candidate dropped feature: ['lcp']
RSS test: 13.83423149083128


Comb n.4: ['lcavol', 'lweight', 'age', 'lbph', 'lcp', 'gleason', 'pgg45']
------------------------------------------------------------------------------------------
candidate dropped feature: ['svi']
RSS test: 17.516627850269806


Comb n.5: ['lcavol', 'lweight', 'age', 'svi', 'lcp', 'gleason', 'pgg45']
------------------------------------------------------------------------------------------
candidate dropped feature: ['lbph']
RSS test: 14.702111705571852


Comb n.6: ['lcavol', 'lweight', 'lbph', 'svi', 'lcp', 'gleason', 'pgg45']
------------------------------------------------------------------------------------------
candidate dropped feature: ['age']
RSS test: 17.03455209459629


Comb n.7: ['lcavol', 'age', 'lbph', 'svi', 'lcp', 'gleason', 'pgg45']
------------------------------------------------------------------------------------------
candidate dropped feature: ['lweight']
RSS test: 16.754443499511755


Comb n.8: ['lweight', 'age', 'lbph', 'svi', 'lcp', 'gleason', 'pgg45']
------------------------------------------------------------------------------------------
candidate dropped feature: ['lcavol']
RSS test: 22.63332934025175


At the end we have:
min RSS: 13.492898446056923
We drop: pgg45
==========================================================================================

==========================================================================================
Iter n.2:

At the beginning we have:
Remaining features: ['lcavol', 'lweight', 'age', 'lbph', 'svi', 'lcp', 'gleason']
Dropped features: [[], 'pgg45']

Now we compare the model selecting 6 variables


Comb n.1: ['lcavol', 'lweight', 'age', 'lbph', 'svi', 'lcp']
------------------------------------------------------------------------------------------
candidate dropped feature: ['gleason']
RSS test: 13.43573406046562


Comb n.2: ['lcavol', 'lweight', 'age', 'lbph', 'svi', 'gleason']
------------------------------------------------------------------------------------------
candidate dropped feature: ['lcp']
RSS test: 12.98960324749752


Comb n.3: ['lcavol', 'lweight', 'age', 'lbph', 'lcp', 'gleason']
------------------------------------------------------------------------------------------
candidate dropped feature: ['svi']
RSS test: 15.244637591703853


Comb n.4: ['lcavol', 'lweight', 'age', 'svi', 'lcp', 'gleason']
------------------------------------------------------------------------------------------
candidate dropped feature: ['lbph']
RSS test: 12.690514046312394


Comb n.5: ['lcavol', 'lweight', 'lbph', 'svi', 'lcp', 'gleason']
------------------------------------------------------------------------------------------
candidate dropped feature: ['age']
RSS test: 14.300531209782973


Comb n.6: ['lcavol', 'age', 'lbph', 'svi', 'lcp', 'gleason']
------------------------------------------------------------------------------------------
candidate dropped feature: ['lweight']
RSS test: 14.364169507348384


Comb n.7: ['lweight', 'age', 'lbph', 'svi', 'lcp', 'gleason']
------------------------------------------------------------------------------------------
candidate dropped feature: ['lcavol']
RSS test: 20.7394303261079


At the end we have:
min RSS: 12.690514046312394
We drop: lbph
==========================================================================================

==========================================================================================
Iter n.3:

At the beginning we have:
Remaining features: ['lcavol', 'lweight', 'age', 'svi', 'lcp', 'gleason']
Dropped features: [[], 'pgg45', 'lbph']

Now we compare the model selecting 5 variables


Comb n.1: ['lcavol', 'lweight', 'age', 'svi', 'lcp']
------------------------------------------------------------------------------------------
candidate dropped feature: ['gleason']
RSS test: 12.70021855056121


Comb n.2: ['lcavol', 'lweight', 'age', 'svi', 'gleason']
------------------------------------------------------------------------------------------
candidate dropped feature: ['lcp']
RSS test: 11.497691985782552


Comb n.3: ['lcavol', 'lweight', 'age', 'lcp', 'gleason']
------------------------------------------------------------------------------------------
candidate dropped feature: ['svi']
RSS test: 14.720875322787679


Comb n.4: ['lcavol', 'lweight', 'svi', 'lcp', 'gleason']
------------------------------------------------------------------------------------------
candidate dropped feature: ['age']
RSS test: 13.183227370610318


Comb n.5: ['lcavol', 'age', 'svi', 'lcp', 'gleason']
------------------------------------------------------------------------------------------
candidate dropped feature: ['lweight']
RSS test: 13.23436777636421


Comb n.6: ['lweight', 'age', 'svi', 'lcp', 'gleason']
------------------------------------------------------------------------------------------
candidate dropped feature: ['lcavol']
RSS test: 16.98150806110247


At the end we have:
min RSS: 11.497691985782552
We drop: lcp
==========================================================================================

==========================================================================================
Iter n.4:

At the beginning we have:
Remaining features: ['lcavol', 'lweight', 'age', 'svi', 'gleason']
Dropped features: [[], 'pgg45', 'lbph', 'lcp']

Now we compare the model selecting 4 variables


Comb n.1: ['lcavol', 'lweight', 'age', 'svi']
------------------------------------------------------------------------------------------
candidate dropped feature: ['gleason']
RSS test: 11.6363032699816


Comb n.2: ['lcavol', 'lweight', 'age', 'gleason']
------------------------------------------------------------------------------------------
candidate dropped feature: ['svi']
RSS test: 14.030539349222018


Comb n.3: ['lcavol', 'lweight', 'svi', 'gleason']
------------------------------------------------------------------------------------------
candidate dropped feature: ['age']
RSS test: 11.956020656419863


Comb n.4: ['lcavol', 'age', 'svi', 'gleason']
------------------------------------------------------------------------------------------
candidate dropped feature: ['lweight']
RSS test: 11.612572746859495


Comb n.5: ['lweight', 'age', 'svi', 'gleason']
------------------------------------------------------------------------------------------
candidate dropped feature: ['lcavol']
RSS test: 18.093182817451503


At the end we have:
min RSS: 11.612572746859495
We drop: lweight
==========================================================================================

==========================================================================================
Iter n.5:

At the beginning we have:
Remaining features: ['lcavol', 'age', 'svi', 'gleason']
Dropped features: [[], 'pgg45', 'lbph', 'lcp', 'lweight']

Now we compare the model selecting 3 variables


Comb n.1: ['lcavol', 'age', 'svi']
------------------------------------------------------------------------------------------
candidate dropped feature: ['gleason']
RSS test: 11.71416952499475


Comb n.2: ['lcavol', 'age', 'gleason']
------------------------------------------------------------------------------------------
candidate dropped feature: ['svi']
RSS test: 14.18793001209106


Comb n.3: ['lcavol', 'svi', 'gleason']
------------------------------------------------------------------------------------------
candidate dropped feature: ['age']
RSS test: 11.484037587414818


Comb n.4: ['age', 'svi', 'gleason']
------------------------------------------------------------------------------------------
candidate dropped feature: ['lcavol']
RSS test: 19.78197534246865


At the end we have:
min RSS: 11.484037587414818
We drop: age
==========================================================================================

==========================================================================================
Iter n.6:

At the beginning we have:
Remaining features: ['lcavol', 'svi', 'gleason']
Dropped features: [[], 'pgg45', 'lbph', 'lcp', 'lweight', 'age']

Now we compare the model selecting 2 variables


Comb n.1: ['lcavol', 'svi']
------------------------------------------------------------------------------------------
candidate dropped feature: ['gleason']
RSS test: 11.58358360007023


Comb n.2: ['lcavol', 'gleason']
------------------------------------------------------------------------------------------
candidate dropped feature: ['svi']
RSS test: 14.140851461764317


Comb n.3: ['svi', 'gleason']
------------------------------------------------------------------------------------------
candidate dropped feature: ['lcavol']
RSS test: 18.710131293690928


At the end we have:
min RSS: 11.58358360007023
We drop: gleason
==========================================================================================

==========================================================================================
Iter n.7:

At the beginning we have:
Remaining features: ['lcavol', 'svi']
Dropped features: [[], 'pgg45', 'lbph', 'lcp', 'lweight', 'age', 'gleason']

Now we compare the model selecting 1 variables


Comb n.1: ['lcavol']
------------------------------------------------------------------------------------------
candidate dropped feature: ['svi']
RSS test: 14.392161587304827


Comb n.2: ['svi']
------------------------------------------------------------------------------------------
candidate dropped feature: ['lcavol']
RSS test: 20.632078139876853


At the end we have:
min RSS: 14.392161587304827
We drop: svi
==========================================================================================
# look at the result
df_BackwardS
| numb_features | RSS_test | min_RSS_test | R_squared | dropped_feature | features | |
|---|---|---|---|---|---|---|
| 0 | 8 | [15.638220165228002] | 15.638220 | 0.694371 | [] | [lcavol, lweight, age, lbph, svi, lcp, gleason... |
| 1 | 7 | [13.492898446056923, 15.495404626758, 13.83423... | 13.492898 | 0.678457 | pgg45 | [lcavol, lweight, age, lbph, svi, lcp, gleason] |
| 2 | 6 | [13.43573406046562, 12.98960324749752, 15.2446... | 12.690514 | 0.656353 | lbph | [lcavol, lweight, age, svi, lcp, gleason] |
| 3 | 5 | [12.70021855056121, 11.497691985782552, 14.720... | 11.497692 | 0.645101 | lcp | [lcavol, lweight, age, svi, gleason] |
| 4 | 4 | [11.6363032699816, 14.030539349222018, 11.9560... | 11.612573 | 0.561456 | lweight | [lcavol, age, svi, gleason] |
| 5 | 3 | [11.71416952499475, 14.18793001209106, 11.4840... | 11.484038 | 0.561005 | age | [lcavol, svi, gleason] |
| 6 | 2 | [11.58358360007023, 14.140851461764317, 18.710... | 11.583584 | 0.560532 | gleason | [lcavol, svi] |
| 7 | 1 | [14.392161587304827, 20.632078139876853] | 14.392162 | 0.537516 | svi | [lcavol] |
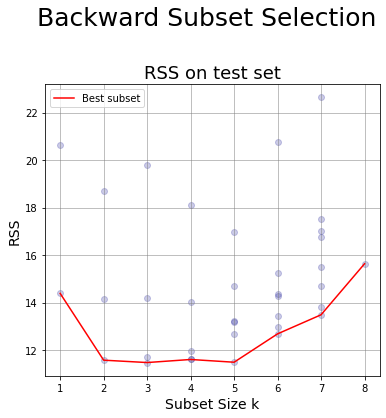
Plot for Backward Selection #
# Initialize the figure
width = 6
height = 6
nfig = 1
fig = plt.figure(figsize = (width*nfig,height))

# 1. RSS Test set plot
tmp_df = df_BackwardS;
ax = fig.add_subplot(1, nfig, 1)
for i in range(0,len(tmp_df.RSS_test)):
    ax.scatter([tmp_df.numb_features[i]]*(len(tmp_df.RSS_test[i])),tmp_df.RSS_test[i], alpha = .2, color = 'darkblue');

ax.set_xlabel('Subset Size k',fontsize=14);
ax.set_ylabel('RSS',fontsize=14);
ax.set_title('RSS on test set',fontsize=18);
ax.plot(tmp_df.numb_features,tmp_df.min_RSS_test,color = 'r', label = 'Best subset'); # line of best values
ax.grid(color='grey', linestyle='-', linewidth=0.5);
ax.legend();

fig.suptitle('Backward Subset Selection',fontsize=25, y=0.98);
fig.subplots_adjust(top=0.8)
plt.show()
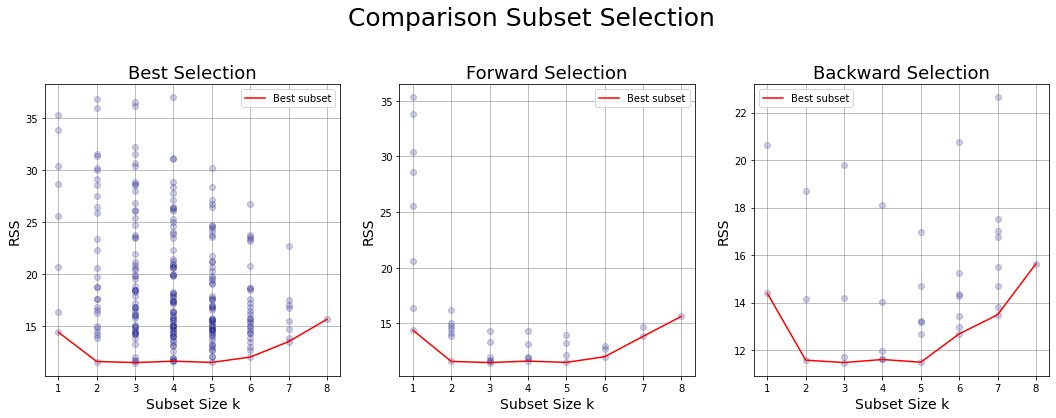
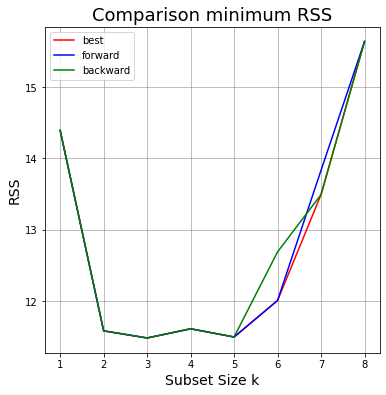
Comparison subset selection methods #
Comparison between Best, Forward and Backward Selction results on test set
# Initialize the figure
width = 6
height = 6
nfig = 3
fig = plt.figure(figsize = (width*nfig,height))

# 1. BEST SUBSET SELECTION
tmp_df1 = df_BestS;           # scatter plot
tmp_df2 = df_BestS_RSS_test; # plot the line of best values
ax = fig.add_subplot(1, nfig, 1)
ax.scatter(tmp_df1.numb_features,tmp_df1.RSS_test, alpha = .2, color = 'darkblue');
ax.set_xlabel('Subset Size k',fontsize=14);
ax.set_ylabel('RSS',fontsize=14);
ax.set_title('Best Selection',fontsize=18);
ax.plot(tmp_df2.numb_features,tmp_df2.RSS_test,color = 'r', label = 'Best subset'); # line of best values
ax.grid(color='grey', linestyle='-', linewidth=0.5);
ax.legend();

# 2. FORWARD SUBSET SELECTION
tmp_df = df_ForwardS;
ax = fig.add_subplot(1, nfig, 2)
for i in range(0,len(tmp_df.RSS_test)):
    ax.scatter([tmp_df.numb_features[i]]*(len(tmp_df.RSS_test[i])),tmp_df.RSS_test[i], alpha = .2, color = 'darkblue');

ax.set_xlabel('Subset Size k',fontsize=14);
ax.set_ylabel('RSS',fontsize=14);
ax.set_title('Forward Selection',fontsize=18);
ax.plot(tmp_df.numb_features,tmp_df.min_RSS_test,color = 'r', label = 'Best subset'); # line of best values
ax.grid(color='grey', linestyle='-', linewidth=0.5);
ax.legend();

# 3. BACKWARD SUBSET SELECTION
tmp_df = df_BackwardS;
ax = fig.add_subplot(1, nfig, 3)
for i in range(0,len(tmp_df.RSS_test)):
    ax.scatter([tmp_df.numb_features[i]]*(len(tmp_df.RSS_test[i])),tmp_df.RSS_test[i], alpha = .2, color = 'darkblue');

ax.set_xlabel('Subset Size k',fontsize=14);
ax.set_ylabel('RSS',fontsize=14);
ax.set_title('Backward Selection',fontsize=18);
ax.plot(tmp_df.numb_features,tmp_df.min_RSS_test,color = 'r', label = 'Best subset'); # line of best values
ax.grid(color='grey', linestyle='-', linewidth=0.5);
ax.legend();

fig.suptitle('Comparison Subset Selection',fontsize=25, y=0.98);
fig.subplots_adjust(top=0.8)
plt.show()
# Initialize the figure
width = 6
height = 6
nfig = 1
fig = plt.figure(figsize = (width*nfig,height))
ax = fig.add_subplot(1, nfig, 1)

# Best Selection
ax.plot(df_BestS_RSS_test.numb_features,df_BestS_RSS_test.RSS_test,color = 'r', label = 'Best subset'); # line of best values

# Forward Selection
ax.plot(df_ForwardS.numb_features,df_ForwardS.min_RSS_test,color = 'b', label = 'Best subset'); # line of best values

# Backward Selection
ax.plot(df_BackwardS.numb_features,df_BackwardS.min_RSS_test,color = 'g', label = 'Best subset'); # line of best values

ax.grid(color='grey', linestyle='-', linewidth=0.5);
ax.set_xlabel('Subset Size k',fontsize=14);
ax.set_ylabel('RSS',fontsize=14);
ax.set_title('Comparison minimum RSS',fontsize=18);
ax.legend(['best','forward','backward'])

plt.show();
Best method from Subset Selection
We see below the results of Best, Forward and Backward Subset Selection.
df_range = [df_BestS_RSS_test, df_ForwardS, df_BackwardS]
columns_range = ['RSS_test','min_RSS_test','min_RSS_test']
methods = ['Best Selection', 'Forward Selection', 'Backward Selection']

for df, col, meth in zip(df_range,columns_range,methods):

    idx = df[col].idxmin()

    print(f"\nFor {meth} the best method has:\n\
n. features: {df['numb_features'][idx]}\n\
features: {df['features'][idx]}\n\
RSS test: {df[col][idx]}\n")
For Best Selection the best method has:
n. features: 3
features: ('lcavol', 'svi', 'gleason')
RSS test: 11.484037587414818


For Forward Selection the best method has:
n. features: 3
features: ['lcavol', 'svi', 'gleason']
RSS test: 11.484037587414818


For Backward Selection the best method has:
n. features: 3
features: ['lcavol', 'svi', 'gleason']
RSS test: 11.484037587414818
Backward selection with Z-score #
11. Perform backward selection using the z-score as a statistics for selecting the predictor to drop
* Start from the full model
* Remove at each step the variable having the smallest Z-score (which library is more suitable for this purpose?)
# a flag to print some info, values {0,1}
flag = 1     # for short info
## range
variables = data.columns.tolist()         # excluding 'const'
remaining_features = variables.copy()
tmpComb = remaining_features.copy()
dropped_features_list= []

## Initialize the list where we temporarily store data
RSS_test_list, R_squared_list = [], []
numb_features, features_list = [], []

# Loop over the number of variables
for k in range(len(variables),0,-1):

    # Compute the stats we need
    Zscores, minZ, idx_minZ = Zscore(X_train[tmpComb],Y_train)
    _, RSS_test, R_squared = LinReg(X_train[tmpComb], Y_train, X_test[tmpComb], Y_test)

    # Save stats
    RSS_test_list.append(RSS_test)
    R_squared_list.append(best_R_squared.copy())

    # Print some information, before upgrading the features
    if flag == 1:
        features = [remaining_features,dropped_features_list]
        params = [RSS_test,R_squared_list,tmpComb]
        if dropped_list: # only if dropped_feature is not an empty list
            dropped_feature = dropped_list[0]
            results = [idx_minZ,RSS_test]
        else:
            results = [RSS_test,[]]

        get_info_backwardS_Zscore(k,features,params,results,detailed)

    # Save features and number of features
    numb_features.append(k)
    features_list.append(tmpComb.copy())

    # update combinations
    tmpComb.remove(idx_minZ)
    dropped_list = list(set(remaining_features)-set(tmpComb))

    # Updating variables for next loop
    if dropped_list: # only if dropped_feature is not an empty list
        dropped_feature = dropped_list[0]
        remaining_features.remove(dropped_feature)
        dropped_features_list.append(dropped_feature)
    else:
        dropped_features_list.append([]) # at the initial iteration we drop nothing!


# Store in DataFrame
df_BackwardS_minZ = pd.DataFrame({'numb_features': numb_features,\
                             'RSS_test' : RSS_test_list,\
                             'R_squared': R_squared_list,\
                             'dropped_feature': dropped_features_list,\
                             'features': features_list})
==========================================================================================
Iter n.0:

At the beginning we have:
Remaining features: ['lcavol', 'lweight', 'age', 'lbph', 'svi', 'lcp', 'gleason', 'pgg45']
Dropped features: []


The Z-scores are:
 lcavol     5.366290
lweight    2.750789
age       -1.395909
lbph       2.055846
svi        2.469255
lcp       -1.866913
gleason   -0.146681
pgg45      1.737840
dtype: float64


At the end we have:
min RSS: 15.638220165228002
We drop: gleason
==========================================================================================

==========================================================================================
Iter n.1:

At the beginning we have:
Remaining features: ['lcavol', 'lweight', 'age', 'lbph', 'svi', 'lcp', 'pgg45']
Dropped features: ['gleason']


The Z-scores are:
 lcavol     5.462426
lweight    2.833132
age       -1.486490
lbph       2.068796
svi        2.519204
lcp       -1.877253
pgg45      2.182013
dtype: float64


At the end we have:
min RSS: 15.495404626758
We drop: age
==========================================================================================

==========================================================================================
Iter n.2:

At the beginning we have:
Remaining features: ['lcavol', 'lweight', 'lbph', 'svi', 'lcp', 'pgg45']
Dropped features: ['gleason', 'age']


The Z-scores are:
 lcavol     5.243670
lweight    2.589758
lbph       1.815545
svi        2.544601
lcp       -1.733570
pgg45      1.871654
dtype: float64


At the end we have:
min RSS: 16.457800398803407
We drop: lcp
==========================================================================================

==========================================================================================
Iter n.3:

At the beginning we have:
Remaining features: ['lcavol', 'lweight', 'lbph', 'svi', 'pgg45']
Dropped features: ['gleason', 'age', 'lcp']


The Z-scores are:
 lcavol     4.899985
lweight    2.551974
lbph       1.952740
svi        2.039752
pgg45      1.190849
dtype: float64


At the end we have:
min RSS: 14.577726321419373
We drop: pgg45
==========================================================================================

==========================================================================================
Iter n.4:

At the beginning we have:
Remaining features: ['lcavol', 'lweight', 'lbph', 'svi']
Dropped features: ['gleason', 'age', 'lcp', 'pgg45']


The Z-scores are:
 lcavol     5.461353
lweight    2.441316
lbph       1.988469
svi        2.458931
dtype: float64


At the end we have:
min RSS: 13.689963661204882
We drop: lbph
==========================================================================================

==========================================================================================
Iter n.5:

At the beginning we have:
Remaining features: ['lcavol', 'lweight', 'svi']
Dropped features: ['gleason', 'age', 'lcp', 'pgg45', 'lbph']


The Z-scores are:
 lcavol     5.507417
lweight    3.655671
svi        1.985388
dtype: float64


At the end we have:
min RSS: 12.015924403078804
We drop: svi
==========================================================================================

==========================================================================================
Iter n.6:

At the beginning we have:
Remaining features: ['lcavol', 'lweight']
Dropped features: ['gleason', 'age', 'lcp', 'pgg45', 'lbph', 'svi']


The Z-scores are:
 lcavol     7.938277
lweight    3.582135
dtype: float64


At the end we have:
min RSS: 14.77447043041511
We drop: lweight
==========================================================================================

==========================================================================================
Iter n.7:

At the beginning we have:
Remaining features: ['lcavol']
Dropped features: ['gleason', 'age', 'lcp', 'pgg45', 'lbph', 'svi', 'lweight']


The Z-scores are:
 lcavol    8.691694
dtype: float64


At the end we have:
min RSS: 14.392161587304827
We drop: lcavol
==========================================================================================
df_BackwardS_minZ
| numb_features | RSS_test | R_squared | dropped_feature | features | |
|---|---|---|---|---|---|
| 0 | 8 | 15.638220 | 0.537516 | gleason | [lcavol, lweight, age, lbph, svi, lcp, gleason... |
| 1 | 7 | 15.495405 | 0.537516 | age | [lcavol, lweight, age, lbph, svi, lcp, pgg45] |
| 2 | 6 | 16.457800 | 0.537516 | lcp | [lcavol, lweight, lbph, svi, lcp, pgg45] |
| 3 | 5 | 14.577726 | 0.537516 | pgg45 | [lcavol, lweight, lbph, svi, pgg45] |
| 4 | 4 | 13.689964 | 0.537516 | lbph | [lcavol, lweight, lbph, svi] |
| 5 | 3 | 12.015924 | 0.537516 | svi | [lcavol, lweight, svi] |
| 6 | 2 | 14.774470 | 0.537516 | lweight | [lcavol, lweight] |
| 7 | 1 | 14.392162 | 0.537516 | lcavol | [lcavol] |
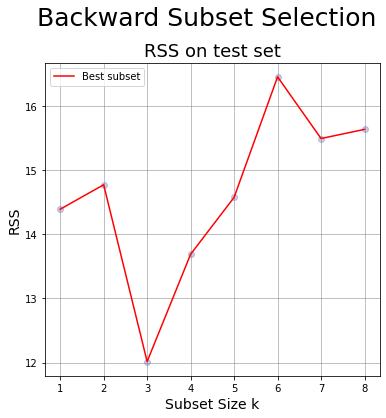
12. Generate a chart having
    * x-axis: the subset size
    * y-axis: the RSS for the test set of the models generated at step 11
* Compare it with the chart generated at point 10.
# Initialize the figure
width = 6
height = 6
nfig = 1
fig = plt.figure(figsize = (width*nfig,height))

# 1. RSS Test set plot
tmp_df = df_BackwardS_minZ;
ax = fig.add_subplot(1, nfig, 1)
ax.scatter(tmp_df.numb_features,tmp_df.RSS_test, alpha = .2, color = 'darkblue');

ax.set_xlabel('Subset Size k',fontsize=14);
ax.set_ylabel('RSS',fontsize=14);
ax.set_title('RSS on test set',fontsize=18);
ax.plot(tmp_df.numb_features,tmp_df.RSS_test,color = 'r', label = 'Best subset'); # line of best values
ax.grid(color='grey', linestyle='-', linewidth=0.5);
ax.legend();

fig.suptitle('Backward Subset Selection',fontsize=25, y=0.98);
fig.subplots_adjust(top=0.85)
plt.show()
Comparison with Z-score #
Now compare the results by choosing the best model not by minimizing RSS but maximizing Zscore.
df_range = [df_BestS_RSS_test, df_ForwardS, df_BackwardS, df_BackwardS_minZ]
columns_range = ['RSS_test','min_RSS_test','min_RSS_test','RSS_test']
methods = ['Best Selection - RSS test', 'Forward Selection - RSS test', 'Backward Selection - RSS test', 'Backward Selection - Z score']

for df, col, meth in zip(df_range,columns_range,methods):

    idx = df[col].idxmin()

    print(f"\nFor {meth}, the best method has:\n\
n. features: {df['numb_features'][idx]}\n\
features: {df['features'][idx]}\n\
RSS test: {df[col][idx]}\n")
For Best Selection - RSS test, the best method has:
n. features: 3
features: ('lcavol', 'svi', 'gleason')
RSS test: 11.484037587414818


For Forward Selection - RSS test, the best method has:
n. features: 3
features: ['lcavol', 'svi', 'gleason']
RSS test: 11.484037587414818


For Backward Selection - RSS test, the best method has:
n. features: 3
features: ['lcavol', 'svi', 'gleason']
RSS test: 11.484037587414818


For Backward Selection - Z score, the best method has:
n. features: 3
features: ['lcavol', 'lweight', 'svi']
RSS test: 12.015924403078804